Claims Test
Conjointly Claims Test is a powerful and comprehensive methodology for testing up to 300 product claims that helps you identify the most convincing claims for your brand or product category. It combines several techniques that Conjointly researchers have developed and refined on full-service projects for FMCG brands:
- Choice of most motivating claim among a set of several claims (similar to conjoint analysis).
- Adaptive experimental design algorithm that reduces sample size and brings clarity around top claims by zooming in on most promising claims.
- Diagnostic questions using Conjointly's unique dual negative-positive scale to help you get a de-biased view of how your customers see each claim and compare results across cultures and countries.
- Open-ended feedback showing both positive and negative reactions to each claim.
Using Claims Test Tool to find the top performing claim with a strong brand association.
Respondents choose the most motivating claims and then review claims separately.
Claims Test surveys can be automatically translated to more than 30 languages.
Bring your own respondents or buy quality-assured panel respondents from us.
Main outputs
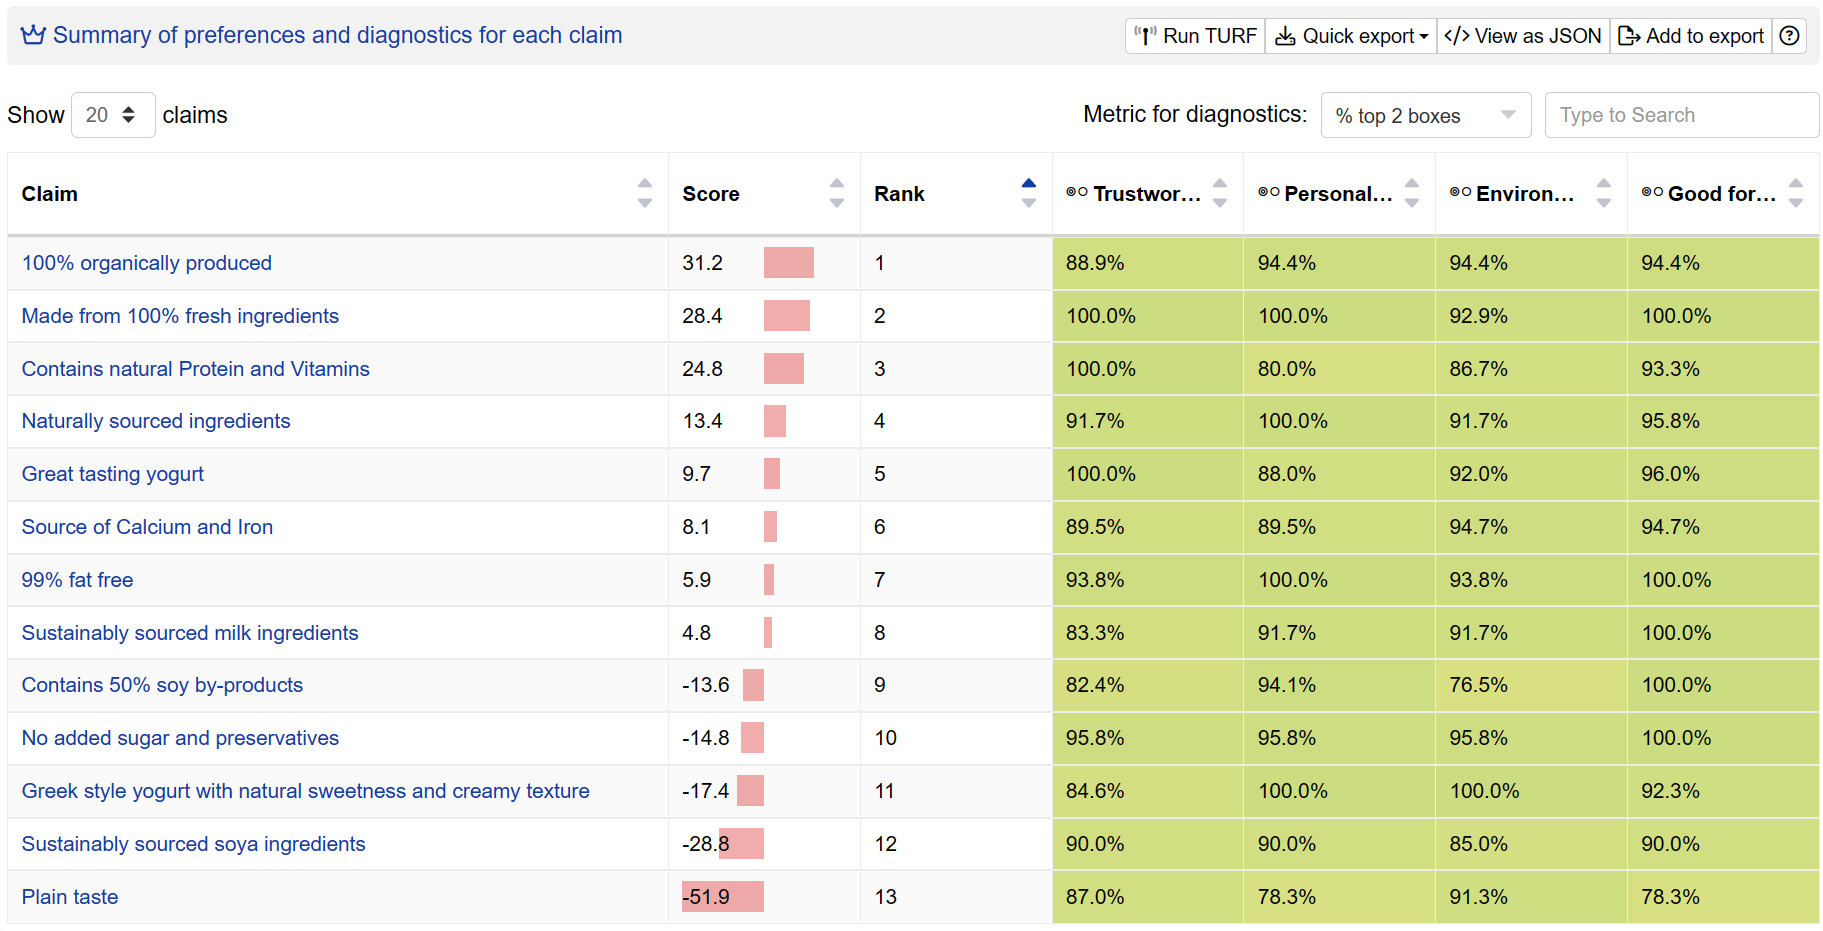
Summary of preferences and diagnostics for each claim
Compare the performance of different claims on several metrics:
- Preference Score (and Rank) from choice-based questions where respondents pick the claims that motivate them most to buy your product.
- Diagnostics help you assess how respondents rate claims on either standard questions ("healthy", "relevant", "premium", etc.) or your own measures.
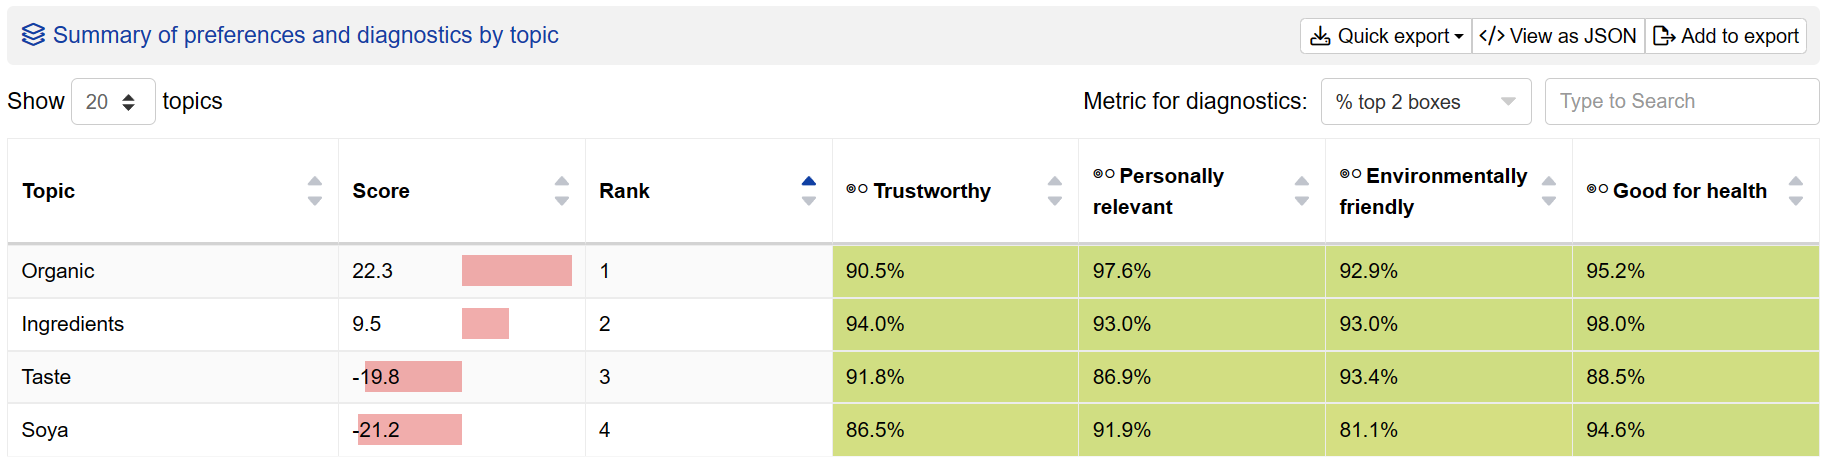
Summary of preferences and diagnostics by topic
If you group claims into different topics, this table will summarise average scores (both preference and diagnostics) for these topics.
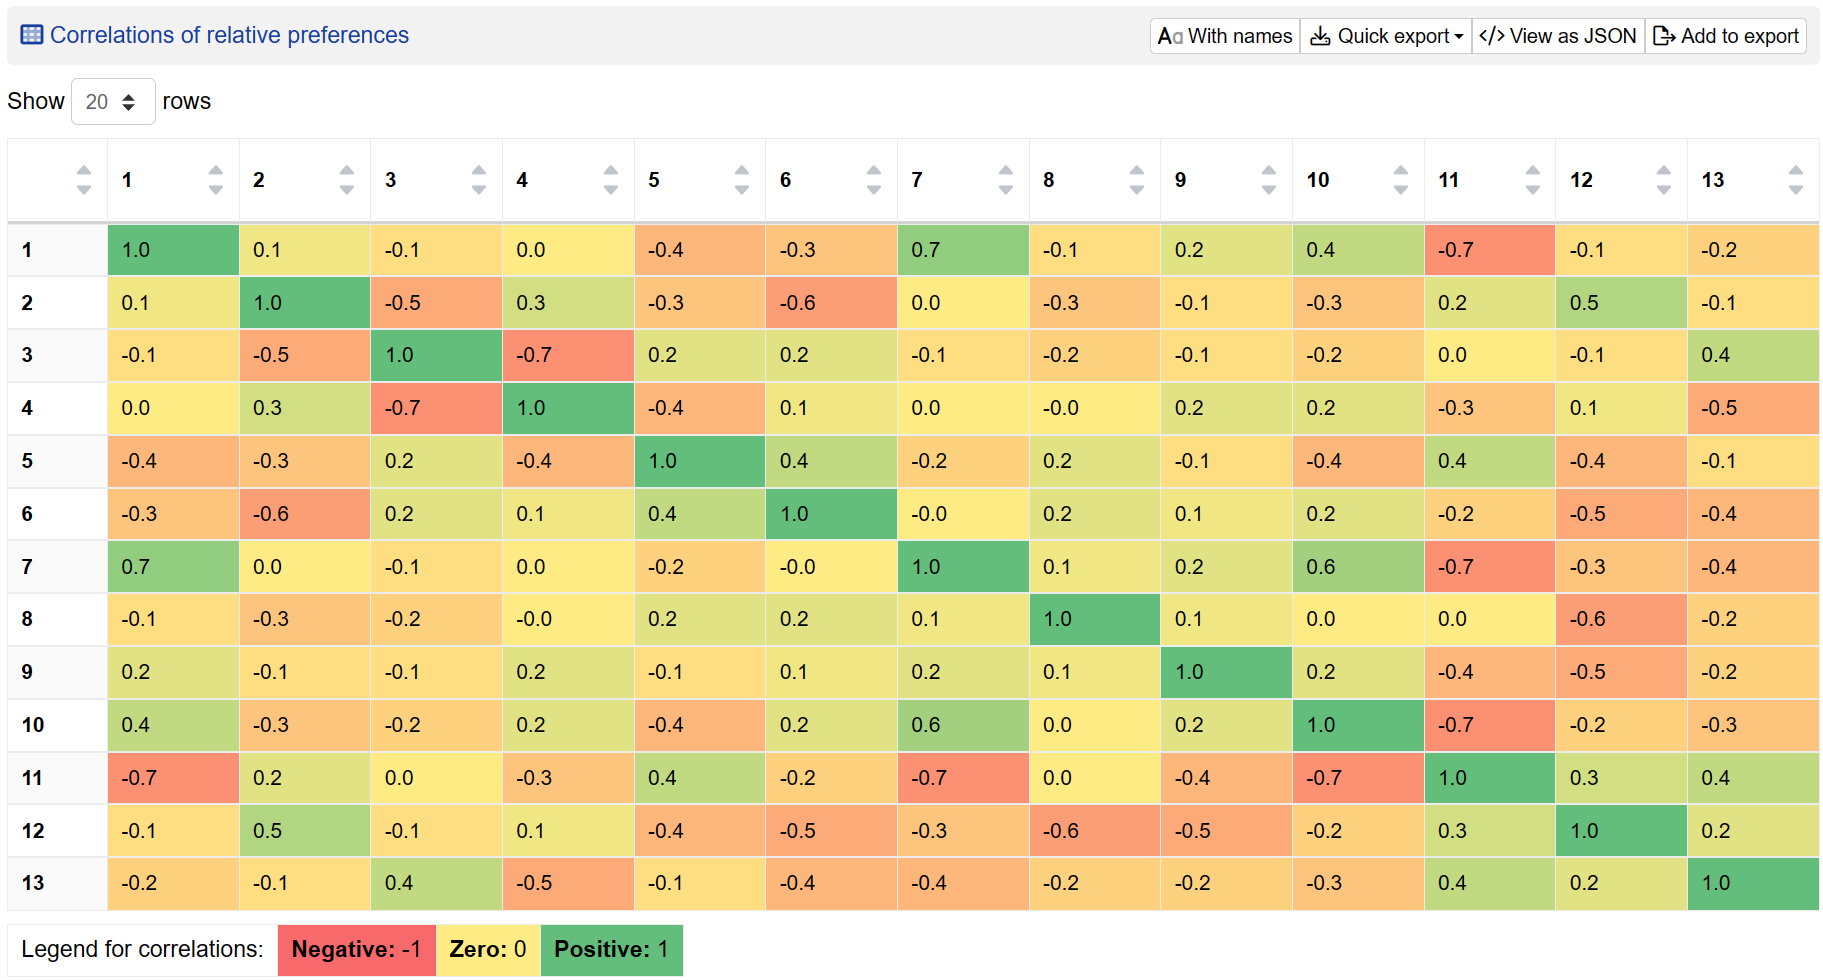
Correlations of relative preferences for claims among respondents
Do you want to know whether people who like the claim "Naturally sourced ingredients" also like the claim "Great tasting yogurt"? With this table, you can explore what preferences are correlated and which are not.
This output provides a clearer understanding of the relationship between claims: A positive correlation between Claims A and B indicates that respondents who like Claim A tend to also like Claim B.
This output is only available for tests of up to 50 claims.
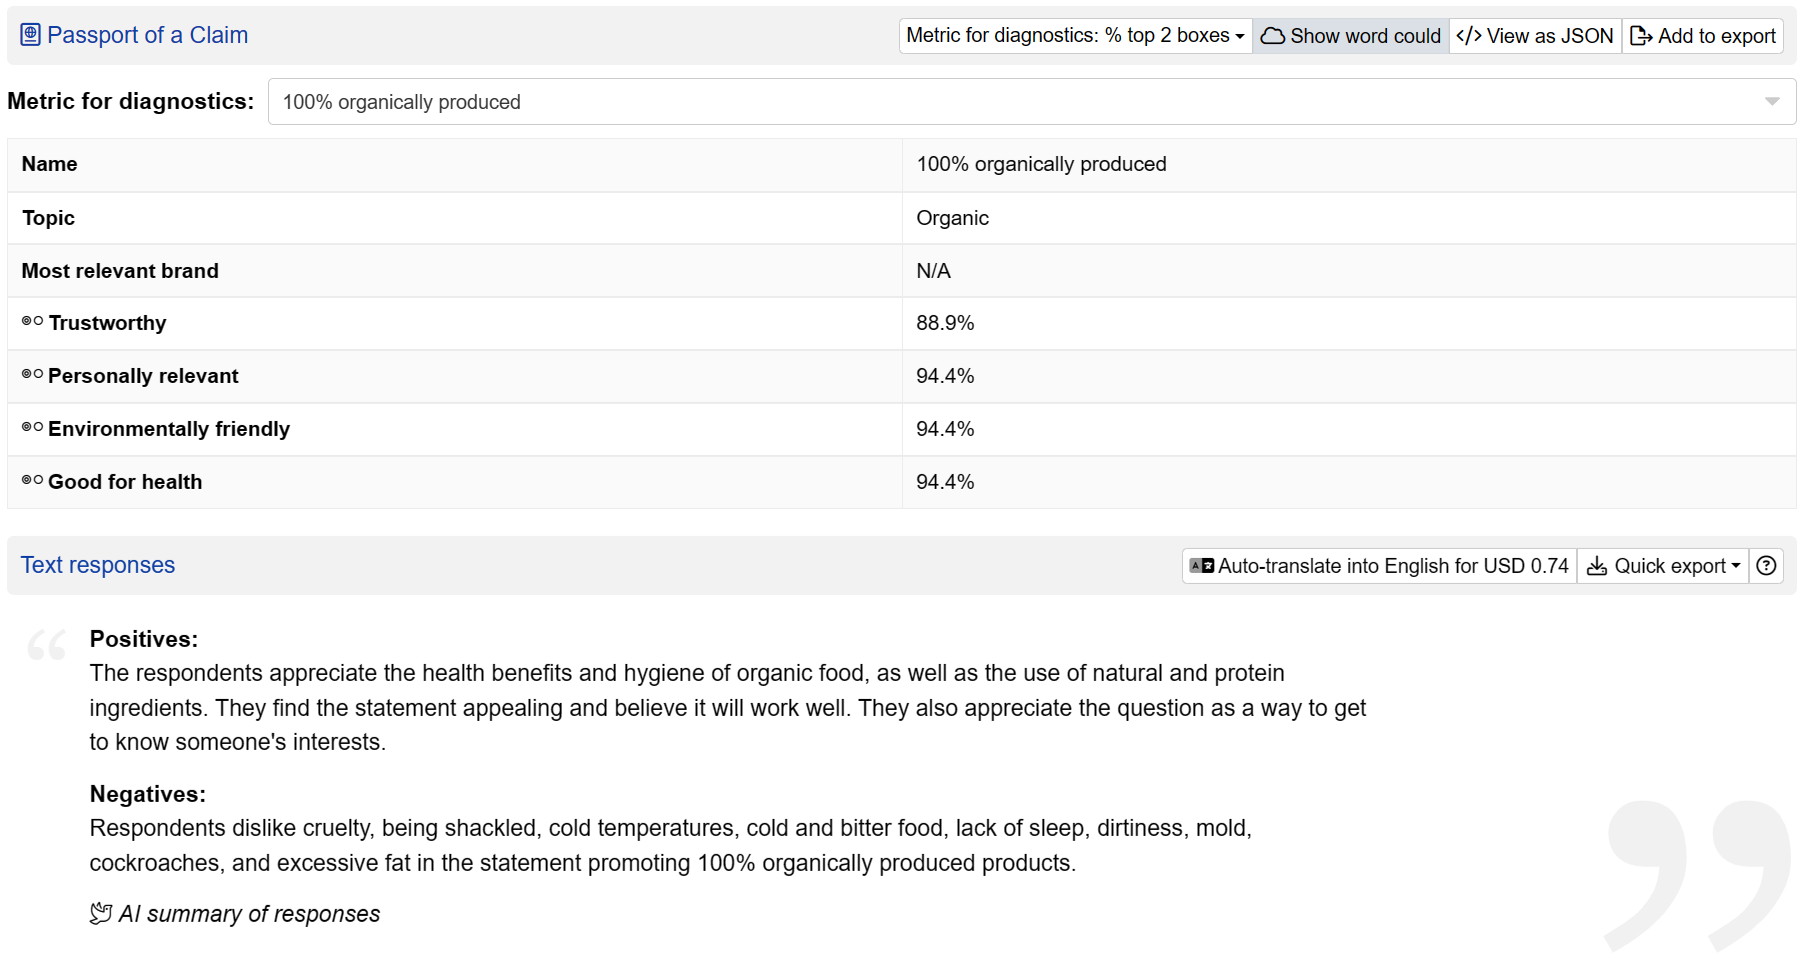
Passport of a claim
Each claim gets its own passport that shows how well it performs on each metric and shows positive and negative reactions to claims.
Claims that are among top claims and also perform well on diagnostics receive a seal of approval as Winning Claims.
TURF analysis
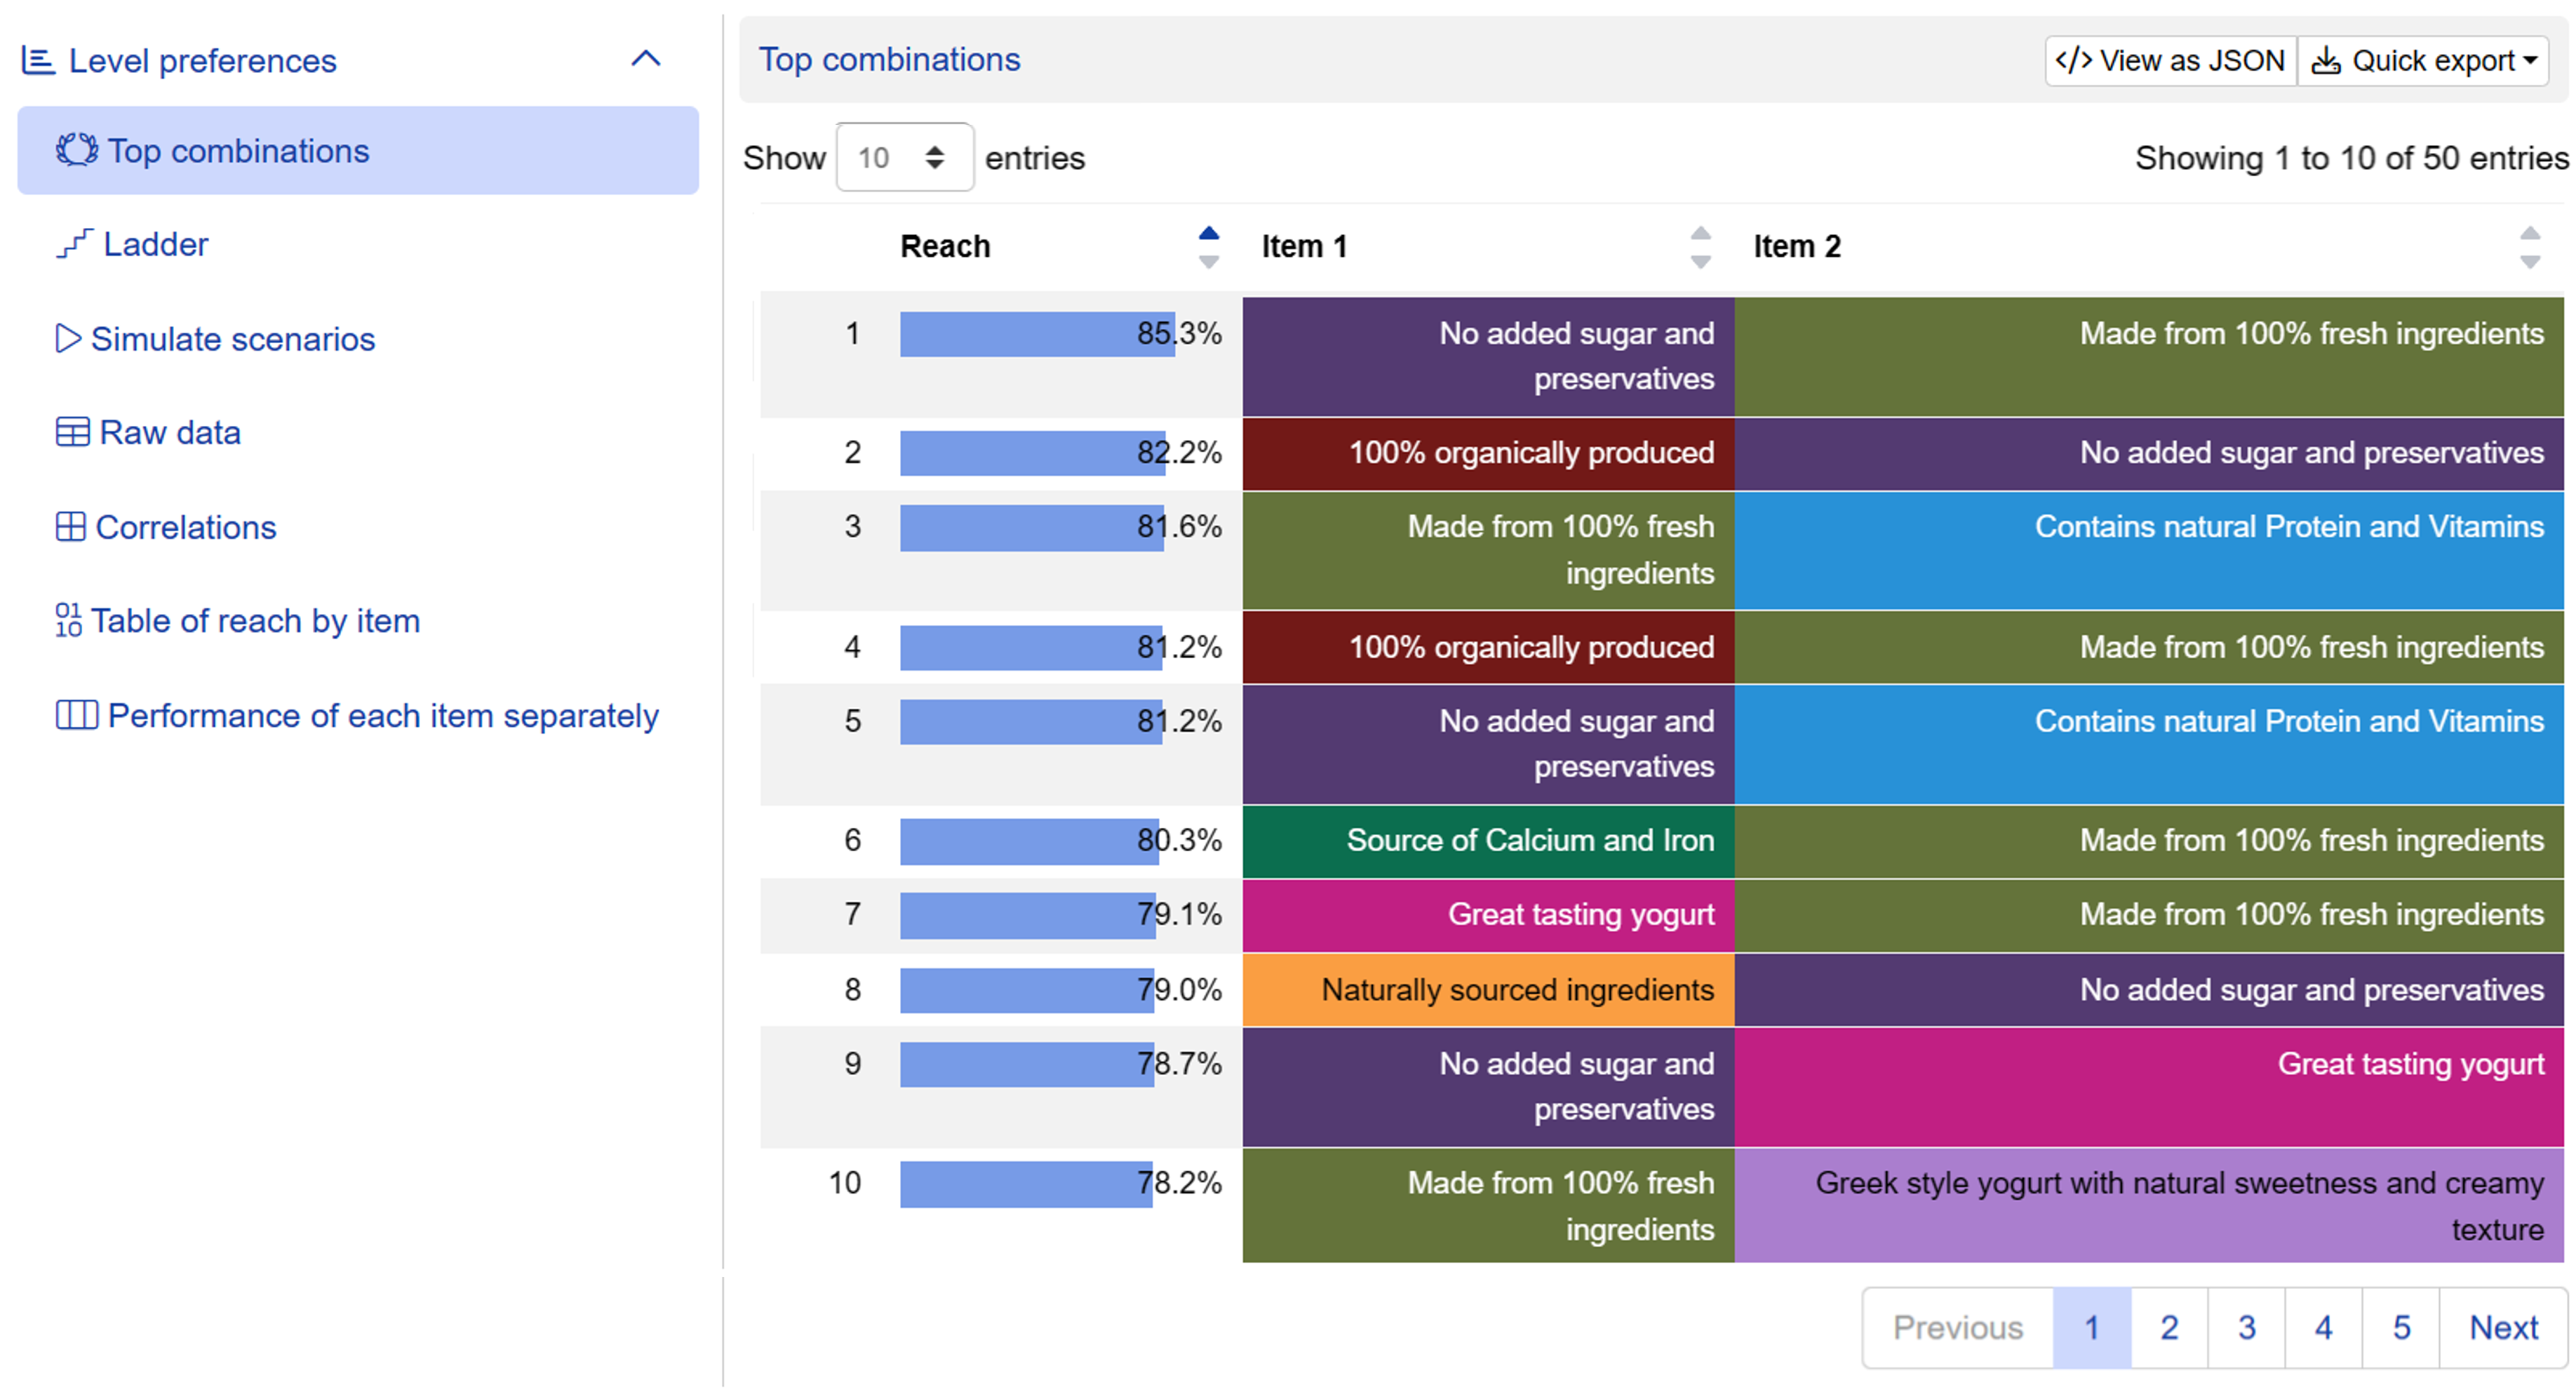
TURF stands for Total Unduplicated Reach and Frequency. It is a technique that came into prominence during the 1950s in the space of media planning. In this report, we are only using the "reach" component of this technique.
Reach is the percentage of respondents for whom at least one of the claims in a particular combination is their most preferred claim. That is, it is a measure of how many respondents can be "activated" by a combination of claims.
Importantly, claims are tested one-by-one (not in combinations). Therefore, one must be careful not to misinterpret this as ranking of preferences for combinations of claims.
This output is only available for tests up to 50 claims.